October 8, 2026
Hydrophytic vegetation indicators, explained
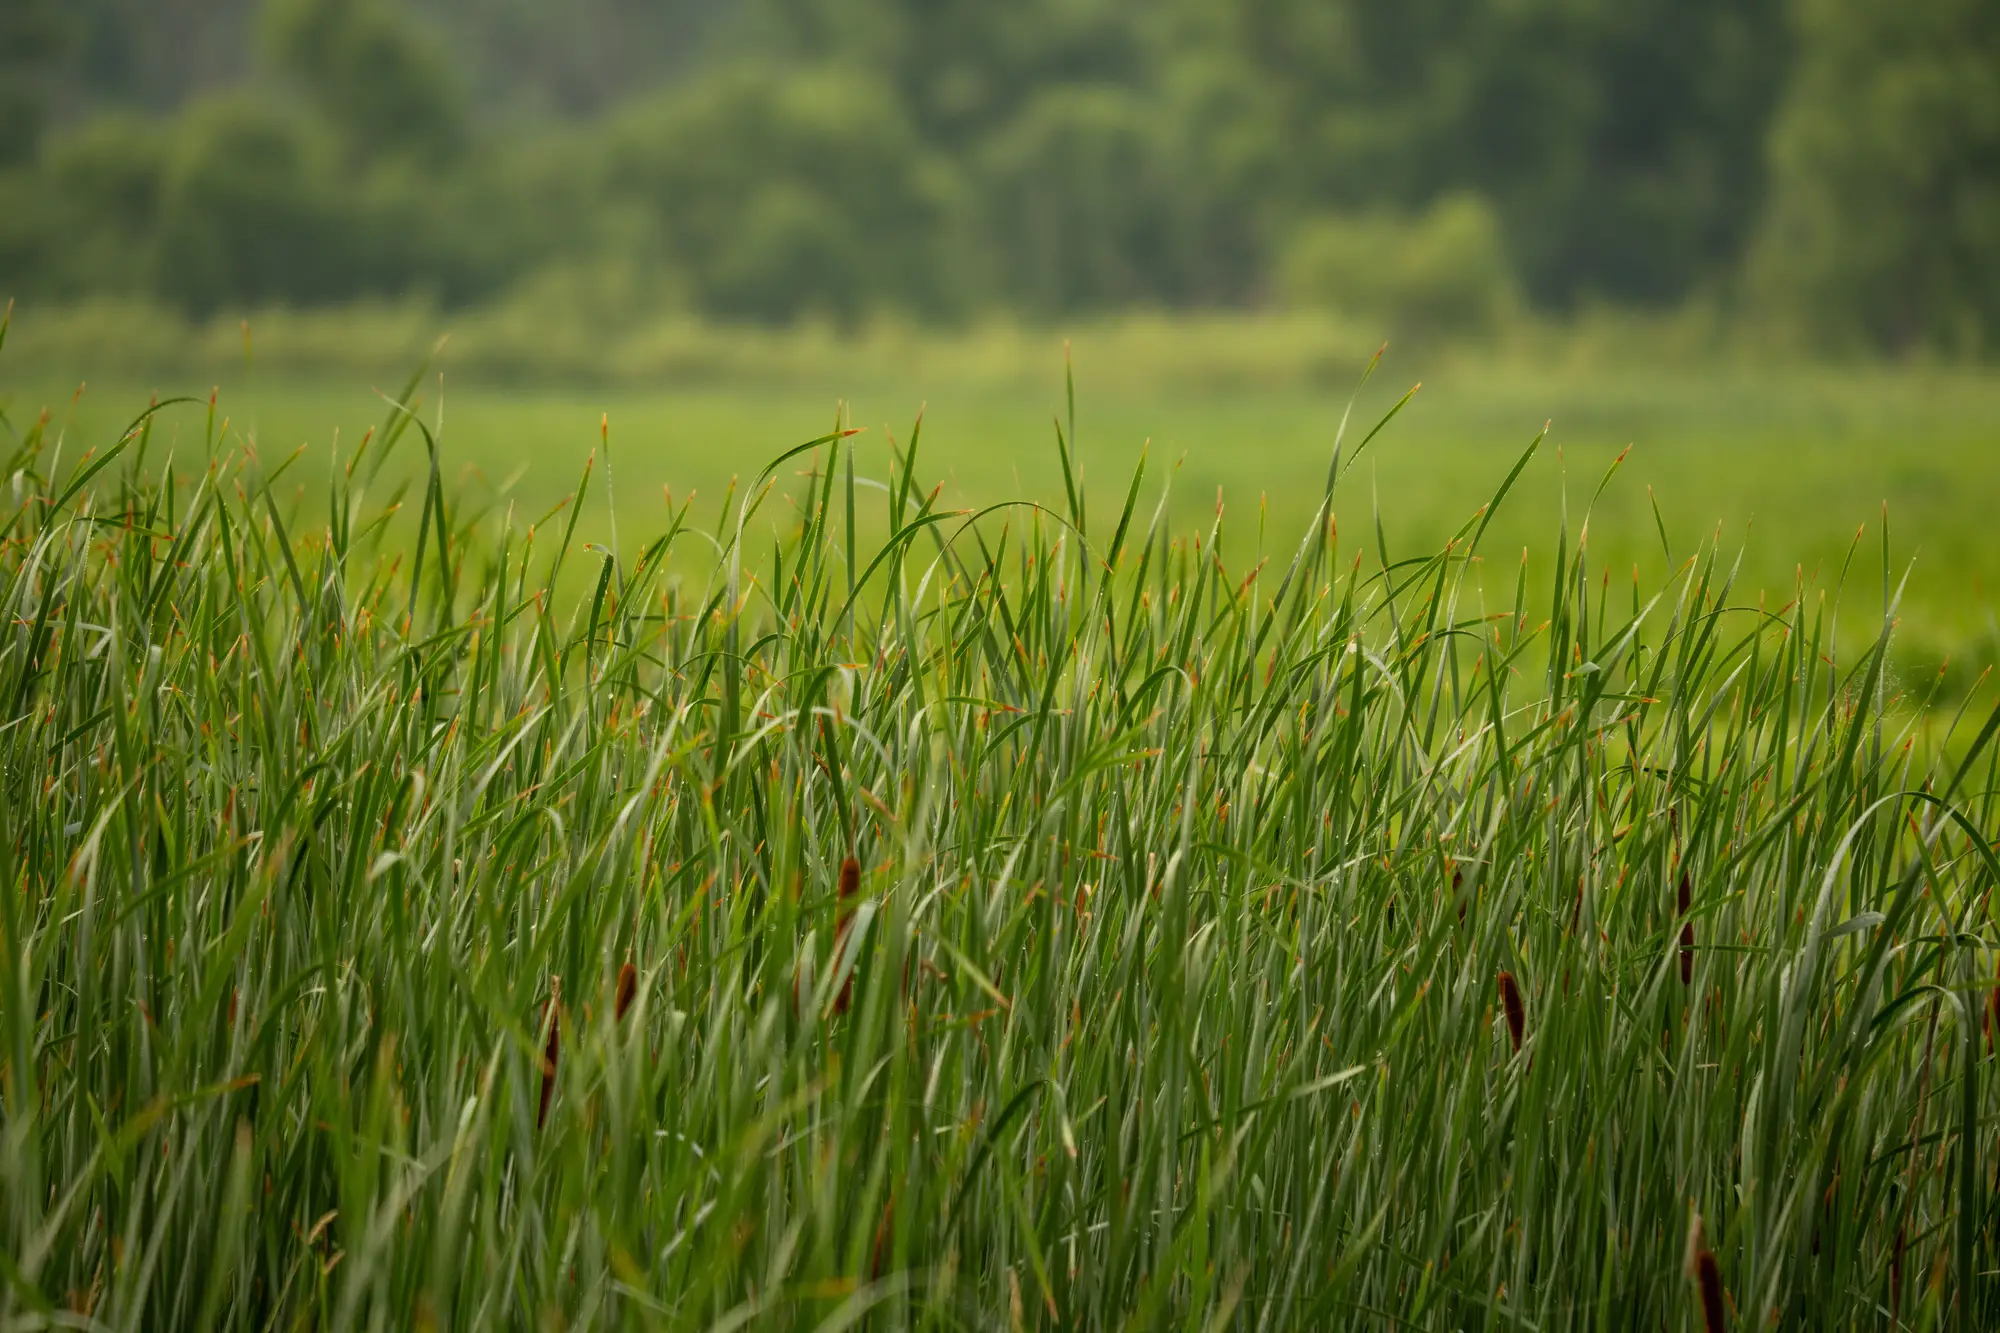
If you've spent any time with the 1987 Corps Manual and a regional supplement open on the tailgate, you already know hydrophytic vegetation is the easiest of the three parameters to get wrong in a hurry. Soils need an auger and a Munsell book. Hydrology needs patience and sometimes a second site visit after a rain event. Vegetation feels like it should be the fast one: look at what's growing, check the list, move on. It's the fast one that trips people up because the list isn't a yes or no answer. It's a probability.
What indicator status actually means
Every species on the National Wetland Plant List carries an indicator status for its region: OBL, FACW, FAC, FACU, or UPL. These aren't categories like "wetland plant" and "upland plant." They're estimated frequencies of occurrence in wetlands versus uplands, based on observed distribution across thousands of plots.
- OBL (Obligate): occurs in wetlands more than 99% of the time. Cattail, most bulrush species, pickerelweed. Find a monoculture of OBL species and you're rarely debating the vegetation parameter.
- FACW (Facultative Wetland): usually in wetlands, 67 to 99% of the time, but shows up in uplands often enough that it's not a lock. Red maple in a lot of regions, silver maple, soft rush.
- FAC (Facultative): the coin-flip category, roughly 34 to 66%. Equally comfortable in a swale or on a ridge. This is where a lot of dominance-test arguments live, because FAC species dominate plots that are genuinely borderline.
- FACU (Facultative Upland): occurs in wetlands only 1 to 33% of the time. Present on a lot of sites, but its presence doesn't carry a plot toward hydrophytic.
- UPL (Obligate Upland): essentially never in wetlands. If UPL species dominate a stratum, that stratum isn't pulling its weight for you.
The regional supplements matter here. A species that's FACW in the Atlantic and Gulf Coastal Plain region can sit at FAC in the Midwest, or even swap sides of the FAC/FACU line depending on the supplement you're working under. Pulling the wrong regional list is a quiet way to fail a determination you'd otherwise have called correctly.
The dominance test, and when you need the prevalence index
Most routine calls use the dominance test: for each vegetation stratum (tree, sapling/shrub, herb, woody vine), you tally the dominant species and check whether more than 50% of them are OBL, FACW, or FAC. If more than half the dominants across strata clear that bar, the plot passes.
The dominance test gets messy on a plot with a lot of FAC species mixed with FACU, especially in a transition zone or a disturbed site where the usual indicator assemblage has been scrambled by grazing, mowing, or fill. That's when you move to the prevalence index, which weights every species in the plot, not just the dominants, by its cover and averages the indicator values numerically. A prevalence index of 3.0 or lower means the plot passes as hydrophytic. It's slower, but it's the right tool for a plot the dominance test can't settle cleanly, and it holds up better if the determination gets appealed.
Where indicator status stops being enough
None of this tells you where the vegetation community has shifted since last season, which is the question that drives a re-delineation request or a boundary dispute. A plot can pass the dominance test this year and still sit on a boundary that's crept thirty feet from where it was surveyed five years ago, especially after a dry stretch or an upstream diversion. Field indicators answer "is this plot hydrophytic." They don't answer "has the wetland gotten smaller since the last site visit," and that second question is the one that shows up in permit renewals and mitigation bank monitoring reports. Wetland Mapping takes an annual multispectral pass over the permit area and flags where the wetland signature has pulled back, so you know which boundary to recheck on the ground before you spend a day walking the whole perimeter.
If a permit file is overdue for a look at what's changed on the ground, that's the gap Wetland Mapping is built to close.